
4th Quarter Investment Outlook: Narrow(er) Straits
By Brian Seay, CFA | Founding Partner, Capital Stewards
At mid-year, we described a slow-growth economy, inflation easing as oil came down, and a portfolio tilted toward international and emerging markets. The third quarter put every one of those ideas to the test. Oil went back above $100. The Federal Reserve raised rates for the first time in three years. And the 10-year Treasury yield touched its highest level since 2002.
And yet the S&P 500 set a new all-time high in early October.
Part of that is exactly what we expected. Since January, our core call has been that this would be a narrow economy — growth concentrated in AI investment and a handful of industries, not a broad boom. That's what we got. A narrow economy produces a narrow market: in the third quarter, four of the largest growth companies did most of the index's work while most stocks fell. That's why we've kept a meaningful tilt toward growth stocks, and that focus has helped our portfolios this year.
The questions I'm hearing from clients and friends across North Alabama have shifted. Four come up again and again:
• With oil back over $100, is inflation coming back?
• The Fed is hiking again. Is that bad news for my portfolio?
• Bonds just lost money again. Why do we still own them?
• With stocks at records and the midterms weeks away, should I be taking risk off?
Below, I'll be straight about what we got right last quarter and what we didn't — and where we think things go from here.
Third-Quarter 2026 Market Recap
After the best quarter since 2020 in the spring — the S&P 500 gained about 15% in Q2 — the third quarter was a grind. The S&P 500 added 2.3% and the Nasdaq about 2.6%. But that headline hides how narrow the market was. The equal-weighted S&P 500 actually lost 1.9%, and roughly 311 of the index's 500 companies finished the quarter lower. Four stocks — Microsoft, Nvidia, Apple, and Meta — added about 300 points to the index on their own.
Underneath, value beat growth, large companies beat small ones, and anything sensitive to interest rates struggled. Small caps fell 7.2%. Utilities fell more than 12% and real estate more than 5%. The winner was energy, up about 17%, as oil came roaring back.
Overseas, developed international stocks gained about 1%, and emerging markets were roughly flat after a 24% run in the second quarter. Bonds had a rough quarter: the broad U.S. bond market lost about 3.4% and municipal bonds about 7%. Commodities were the standout, up more than 16%, and gold added a little under 4%.
Zoom out to the full year and the picture is still healthy. Through the end of September, the S&P 500 is up roughly 12.75% including dividends — on pace for its best midterm-election year since 2006.
The Long View
Every quarter I come back to the long view, because it's the best antidote to a noisy three months. Over the last 30 years — a stretch that includes the dot-com bust, the financial crisis, COVID, and now a war with Iran — the S&P 500 has returned close to 10% a year. Bonds averaged about 4%, gold a little over 9%, and inflation about 2.6%. Over the last decade, U.S. large caps compounded at roughly 15% a year, with gold in second place at almost 12% a year and bonds essentially flat.
Here's why that matters right now. This quarter, bonds lost money while stocks hit records. Last spring, it was the reverse. A diversified portfolio will almost always own something that's lagging. That's not a flaw in the plan. That is the plan.
You should feel confident in your portfolio in both up and down markets. If a quarter like this one has you second-guessing, that's a good prompt to sit down with us or get a second opinion.
Iran and Oil: What Changed, and What Didn't
At mid-year, my view on Iran was that we'd see very little real change — a gridlocked conflict, lots of can-kicking, and neither side moving far from where it stood. We titled that outlook "Narrowing Straits," on both the economic and geopolitical front. On that, I think we were right. Compare today to July 1: the U.S. is still blockading Iran's oil exports, Iran is still insisting on its terms for the Strait of Hormuz, and talks keep starting and stalling. Late in September, the U.S. rejected an Iranian proposal to reopen the Strait.
Where I was wrong was price. I expected oil to stabilize near mid-year levels. Instead, the June memorandum of understanding broke down in mid-July when Iran attacked ships in the Strait and the U.S. struck back. In September, Houthi attacks on Saudi energy infrastructure added a second supply shock, and Ukrainian strikes on Russian refineries further crimped supplies of refined products, most notably diesel. WTI crude rose more than 30% in the quarter, and Brent averaged over $100 in September. The situation stayed stuck, but the price of being stuck went up.
What's Actually Moving Through the Strait of Hormuz
This is where the headlines and the data diverge. Before the war, roughly 17 million barrels a day of oil and fuel moved through Hormuz by ship, according to Kpler. At the worst point this summer, independent analysts put flows at only 4 to 6 million barrels a day — a loss on the order of 11 to 13 million barrels a day at the trough.
That has recovered a lot. In late September, Kpler had crude plus fuel moving through the Strait at about 14 million barrels a day on a seven-day basis — roughly 80% of pre-war levels. Vortexa, measuring more broadly to include LPG and other oil products, put it at 65% to 70%.
How is it moving? Largely in the dark. Most tankers now cross with their tracking transponders switched off so they're harder to target. One maritime intelligence firm counted 102 tanker transits in the three weeks after the blockade resumed on July 14: 62% went dark, including 79% of crude tankers. Many are short shuttle runs under U.S. naval protection — load inside the Gulf, cross, and hand the cargo to a larger ship waiting off Oman. It's working, but it isn't safe: three tankers running dark were hit by projectiles on September 29.
However, the recovery in shipping is almost all crude. Refined fuels — the diesel and jet fuel that Gulf refineries export — were moving through the Strait at under 700,000 barrels a day in late September, versus 3.6 million before the war. That's less than a fifth of normal.
What do I expect from here? The trend in physical flows is improving even without a deal, the world has meaningful capacity outside the Gulf, and every month of $100 oil speeds up investment in routes that bypass the Strait. High prices tend to cure high prices. I don't see a return to $120 WTI, because I think a combination of slowing demand and changing shipping patterns will keep prices from moving much higher. The timing, though, is out of anyone's hands — which is exactly why we don't build portfolios that depend on getting it right.
The Real Squeeze: Diesel and Crack Spreads
If you want to understand inflation, freight costs, and a lot of what's happening in energy stocks this year, you need one term: the crack spread. It's the difference between what a refiner pays for a barrel of crude and what it sells the fuel for — essentially the refining margin, or the toll for turning crude into something a truck can burn.
That toll is at a record. The diesel crack spread — New York Harbor diesel versus WTI crude — averaged about $111 a barrel in September, the highest on record. Even after inflation, that tops the October 2022 peak during Russia's invasion of Ukraine. A normal level in the 2010s was $20 to $30.
The refining margin is now bigger than the crude itself. Since February, a barrel of diesel has risen about $103, and roughly two-thirds of that was margin, not oil. Diesel isn't expensive mainly because crude is expensive. It's expensive because there aren't enough fuel barrels.
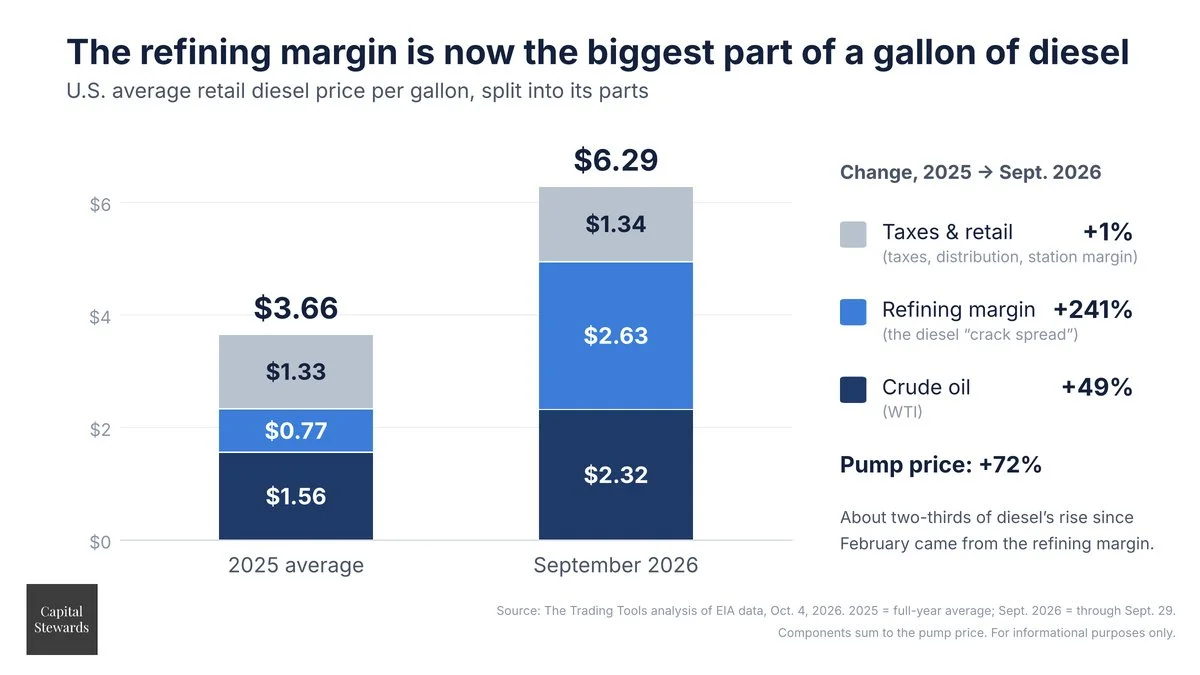
What's driving it. Four things at once:
1. Missing Gulf fuel exports. Crude flows through Hormuz are back near 80% of normal, but refined fuel exports are under a fifth.
2. Refinery damage elsewhere. Attacks on Russian refineries, and Houthi strikes that shut Saudi Arabia's Red Sea export port at Yanbu, took more fuel supply offline.
3. Too little refining capacity. Years of closures and underinvestment leave no slack to absorb a shock.
4. The calendar. Diesel demand peaks from October through February — harvest, then heating season. A Gulf of Mexico hurricane in October also temporarily shut in more than 60% of offshore oil production.
What could narrow it in Q4. The biggest lever is fuel shipments out of the Gulf catching up to crude. If the shuttle system that restored crude flows extends to product tankers, a lot of supply comes back quickly. A ceasefire would help. High prices also destroy demand, as truckers, farmers, and builders cut back at $6 diesel. And history favors mean reversion: in six of the nine diesel-margin spikes since 1989, the spread fell by roughly half or more within six months. The EIA expects the diesel margin to stay above $2 a gallon through November, then decline steadily through mid-2027.
What could keep it wide. A cold winter, more strikes on refineries or tankers, another storm, or low inventories heading into heating season. One policy wildcard: the administration floated, then denied, a ban on diesel exports, which would push U.S. prices down but international prices up without fixing the underlying shortage.
Why it matters for your portfolio. First, diesel is a tax on everything that moves — it feeds into freight, food, and construction costs with a lag. That's the main risk to our view that core inflation cools. Second, it's the flip side of our thesis: if the crack spread narrows, headline inflation gets relief even if crude oil doesn't fall at all. That's a big part of why I think the inflation picture improves in 2027.
The other side. The research on past spikes is sobering. After nine diesel-margin spikes since 1989, the S&P 500's median return over the following year was about 3%, versus about 12% normally. In the three spikes that lasted most of a year — 2000, 2011, and 2022 — stocks fell 17% to 22% at some point. This one is already more persistent than most. The more encouraging data point: measured from six months into a spike, where we are now, the following year looked much closer to normal. It's a reason to stay diversified, not a reason to sell.
The Economy: Growth, but Narrow Growth
Our view on the economy hasn't changed since January: growth, but narrow growth. Economists still expect real GDP growth of about 2.1% this year. Nominal GDP forecasts have risen, but that's inflation, not a real pickup in activity. Retail sales were up 6.3% from a year earlier in September, but after backing out inflation the gain is closer to 2.5%. That's solid enough to rule out near-term recession worries, but the economy isn't speeding up.
Growth also remains narrow. Business spending on AI — data centers, chips, power equipment — is still doing a huge share of the lifting and offsetting weakness in housing and anything else sensitive to interest rates. Strip out the AI buildout and you have an economy growing slowly, which is what we've said all year.
The Labor Market: Low Hire, Low Fire
The jobs market tells that story most clearly. September's report showed just 29,000 jobs added, against expectations near 90,000. July and August were revised down by a combined 60,000, leaving the three-month average around 51,000 a month. Unemployment ticked up to 4.2% and has been stuck between 4.1% and 4.3% since March.
After shrinking for most of the first half, the labor force is growing again — likely as more people look for work to offset higher prices. That means the economy is not creating enough jobs for the people looking for them, for the first time in a while. I don't expect the labor market to deteriorate significantly, but it isn't getting stronger.
What we're seeing is a low-hire, low-fire labor market. Companies aren't laying people off in meaningful numbers — the ingredient a recession usually needs — but they aren't hiring much either. And here's the number I'd underline: wages grew just 3.0% over the past year, the slowest pace since May 2021. With headline inflation running in the mid-3% range, the typical worker is falling slightly behind. That's not an economy generating its own inflation.
Inflation: A Tale of Two Inflations
There are really two inflation stories right now. The first is the one you feel at the pump. Headline CPI was 3.4% in August, and gasoline alone accounted for more than a third of that month's increase. That's the oil story, and it's real.
The second is everything underneath. Core CPI — which strips out food and energy — fell to 2.4% in August, the lowest reading since March 2021. At mid-year, I said I expected core CPI below 2.5% by year-end, and in August we were there. The Fed's preferred core measure, core PCE, came down too, from 3.4% in May to 3.0% in August.
The drivers are the ones we've talked about. Shelter — the biggest piece of core inflation — had been cooling all year, with rents and owners' equivalent rent rising just 0.2% in August. Wages are growing 3.0%. A labor market adding 29,000 jobs a month isn't going to start a wage-price spiral.
The real-time data says the same thing. Wholesale used-car prices (the Manheim index) fell 1.1% in September and are now 0.6% below a year ago, the first year-over-year decline of 2026. At mid-year, Cox Automotive expected used-car values to finish the year up about 2%; it now expects roughly 0.2%. Market rents are soft too: Apartment List's national median rent slipped 0.1% in September and is down 0.4% from a year ago. Rents on new leases lead the CPI shelter number by many months, which supports shelter continuing to cool into 2027.
Then Came September
The September CPI report, released October 14, was hotter than expected. Headline CPI rose 0.6% for the month and 3.7% over the year, and gasoline alone — up 9.1% in September — was more than half of that. That part we expected. What we didn't expect was core: it rose 0.3% for the second month in a row, and the year-over-year rate moved back up to 2.6%. Economists were looking for 0.2% and 2.5%.
When I look at where it came from, it's mostly oil leaking into everything else. Airfares rose another 1.2% in the month and are up more than 22% over the year. Used-car prices rose 0.7%. And shelter, which had been cooling, rose 0.4%.
Does this change our view? It changes our timing, not our direction. Two of those three pieces should reverse: wholesale used-car prices fell more than 1% in September and usually reach the CPI a couple of months later, and rents on new leases are flat to down. Airfares are the honest risk — they come down when oil does, and not before. So I now expect core CPI to get back below 2.5% in the first half of 2027, not by December. For what it's worth, the bond market seems to agree: after yields jumped on the initial report, they fell once investors had time to digest the details.
What could prove me wrong. Three things I'm watching. First, airfares — oil leaking into services. Second, business input costs: the prices-paid index in ISM's manufacturing survey jumped to 77.9 in September, and the services version hit 74.0, the highest since July 2022, with 17 of 18 service industries reporting higher costs. Those surveys tend to lead consumer prices by a few months. Third, consumers now expect 4.6% inflation over the next year, according to the University of Michigan, and expectations can become self-fulfilling. If diesel stays elevated long enough, more of it will seep into core. That's why I'd describe our view as "core cools, but slowly and later than we hoped," not "inflation is solved."
The Fed's First Rate Hike Under Chair Warsh
This is another place I was wrong. At mid-year I read the Fed's hawkish talk as mostly expectation management — talking tough so it wouldn't have to act. On September 16, it acted. The Fed raised rates a quarter point to a range of 3.75% to 4.00%, its first increase since July 2023 and the first under Chair Kevin Warsh. The vote was unanimous.
Warsh gave three reasons: an economy that has held up, inflation that stayed elevated over the summer, and an energy shock that has lasted long enough to risk spreading. Normally the Fed looks through oil spikes. This committee decided this one had gone on too long.
What matters for portfolios is what's priced in. At the end of September, markets were pricing roughly four more quarter-point hikes over the next year. The Fed's own projections are more modest: the median official sees rates around 4.1% at the end of this year and next year — essentially one more small step or a hold, not a campaign. Warsh himself described September as "removing accommodation," not tightening.
The weak September jobs report then pushed the odds of a hold at the October meeting to about 77%, before the hot September inflation report put another hike back on the table. The Fed meets again October 28. My view is that the Fed may hike one or two more times, but not four — and that's beginning to be reflected in markets.
U.S. Stocks: Is This a Bubble?
The question I get more than any other is whether this is a bubble. My answer is the same as last quarter, and the evidence got stronger.
Earnings are carrying this market. Second-quarter S&P 500 earnings grew about 32% excluding mark-ups on AI investment holdings, and 86% of companies beat estimates. Heading into third-quarter reports, FactSet estimated growth near 29.6% — and, unusually, analysts raised their estimates during the quarter, from 26.7% at the end of June. Normally estimates drift down. If companies beat by their usual margin, FactSet expects actual Q3 growth above 35%. For the full year, analysts now expect about 32% earnings growth.
Because earnings have grown faster than prices, the market has actually gotten cheaper. The S&P 500 started the year at about 22.2 times forward earnings. As of October 9, it traded at about 19.1 times — right at its 10-year average.
I don't want to oversell it, because the third quarter also showed the weak spot: concentration. Four companies drove most of the quarter's gain while most stocks fell. Within tech, the AI trade got more complicated — competition from Chinese AI models, a sharp momentum unwind in July, growing pushback on data-center construction, and security concerns. AI companies are also borrowing heavily to fund the buildout, and that debt competes with Treasuries for investors' dollars.
The other side. The strongest bear case is a math argument. At about 19 times earnings, stocks offer an earnings yield of about 5.2%. The 10-year Treasury yields about 5.1% to 5.3%. For the first time in a long time, investors aren't getting paid much extra to own stocks over a risk-free government bond. That doesn't make stocks expensive by historical multiples, but the cushion is thin if earnings disappoint.
Our approach hasn't changed: own the AI leaders, but don't double up. We're deliberate about not stacking AI exposure across mega-cap tech, data-center real estate, and the chip-heavy corners of emerging markets.
Small Caps
At mid-year, small caps were having their best first half since 1991, and I said on the podcast I wouldn't bank on a repeat. The rally was a margins-and-rates story, not a sales story, and small-cap earnings estimates have a habit of disappointing.
The third quarter showed why that caution mattered. The Russell 2000 fell 7.2% while large caps rose, narrowing small caps' lead for the year to just over 1.5 percentage points. Small companies lean more on borrowing, and more of that debt floats with interest rates, so the first Fed hike in three years and a jump in Treasury yields hit them hardest. Energy was the only small-cap sector that rose.
Small caps are still part of a diversified portfolio and tend to do well when rates eventually come down. But they're the part of the market most exposed to our rate call. If yields stay near 5% longer than we expect, this is where investors will feel it first.
International and Emerging Markets: The Dollar Test
International and emerging markets have been outperformers for the last couple of years. In the third quarter, they took a breather: developed international stocks rose about 1% and emerging markets slipped about half a percent, while the S&P 500 gained 2.3%.
The main reason is the dollar. Our thesis depends in part on a softer dollar over time, and this quarter it went the other way — the U.S. Dollar Index hit new 2026 highs in early October, near 102. When the Fed is hiking and the 10-year pays over 5%, money flows toward the dollar. Higher oil also hurts Europe and much of Asia more than the U.S., because they import their energy. Europe had a tough quarter, with oil and a European Central Bank that has started raising rates. Japan was the bright spot, on strong earnings, rising buybacks, and continued corporate reform.
Why Oil Is the Swing Factor for the Dollar
This year, the dollar has moved with oil more than with the Fed. Historically the two tended to move in opposite directions. But the U.S. is now the world's largest oil producer, so an oil spike helps our trade balance while hurting energy importers like Europe and Japan. Add safe-haven buying during the war, and the dollar has effectively been trading with a war premium. In late August, with Brent averaging in the high $80s, the Dollar Index sat around 99 — about 3% below where it is today.
If Brent settles back into the $80 to $90 range, I'd expect much of that war premium in the dollar to come out. A softer dollar would help international and emerging-market stocks, local-currency emerging-market bonds, and gold — all at once. Lower oil would also ease headline inflation and take pressure off the Fed.
In emerging markets, July's global momentum selloff and a rotation out of chipmakers kept a lid on returns. That's a reminder of something I flagged at mid-year: EM has quietly become a tech index. The three largest stocks in the MSCI Emerging Markets index are semiconductor companies, together about 29% of it. In South Korea, two chip stocks make up 63% of the country index. Investors need to be just as careful about AI concentration abroad as at home.
We're staying the course. One flat quarter comes after one of the best runs in decades, and EM remains ahead of the S&P 500 for the year. The structural case hasn't changed: lower valuations, healthier government balance sheets, and faster earnings growth. And the dollar's strength depends on the U.S. keeping its rate advantage. More than 80% of developed-market central banks raised rates alongside the Fed this quarter, so that advantage isn't widening the way it would need to for a sustained dollar rally.
The other side. If the Fed keeps hiking and 5% Treasuries keep drawing money home, the dollar can stay strong for a long time — a headwind for everything we own abroad. That's a real risk, and it's why international is a meaningful tilt in our portfolios, not an all-in bet.
Bonds at 5%: The Best Starting Yields in 25 Years
The 10-year Treasury closed September at 5.3%, about eight-tenths of a point higher than three months earlier, and in early October it briefly touched its highest level since April 2002.
It wasn't just the Fed. Oil and sticky headline inflation pushed long rates up. So did large government deficits, some weak Treasury auctions, and a new factor: AI companies issuing enormous amounts of debt to fund data centers, competing with Treasuries for buyers. The selloff was global, too — 30-year yields in Japan and the U.K. reached levels not seen since the late 1990s.
So why are we still comfortable? Because of where yields are now, not where they were.
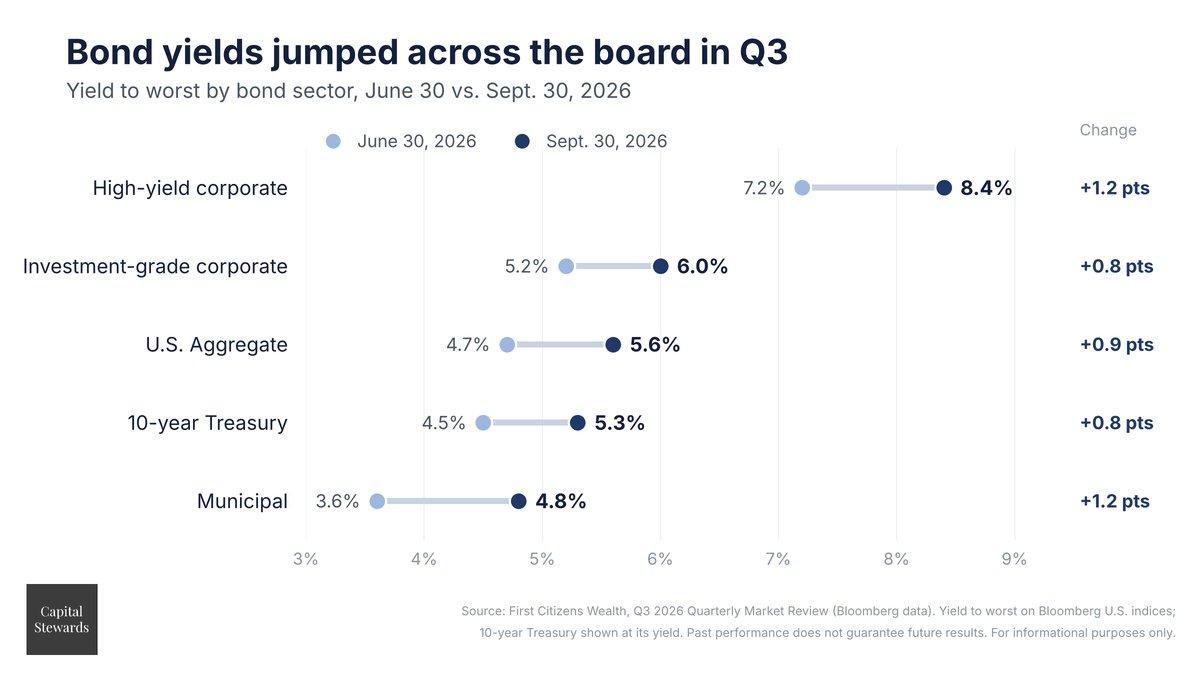
With core inflation running between 2.6% and 3.0%, a 5.3% Treasury offers a real return of roughly 2.5% before you do anything clever. For investors in high tax brackets, a 4.8% municipal yield is worth about 7.6% on a taxable-equivalent basis at the 37% federal rate — more for Alabama municipal bonds held by Alabama residents. Those are the most attractive starting yields for high-quality bonds in about 25 years.
There are early signs the selling may be exhausting itself. In early October, the Treasury sold 10-year notes at 5.30%, the highest auction yield since November 2000, and demand was stronger than expected. Bonds snapped a five-week losing streak.
Then came another clue. When September's inflation report came in hotter than expected on October 14, bonds sold off right on cue — the 10-year yield jumped in the first minutes after the release. But buyers stepped in, and by the close the 10-year yield was lower than where it started that morning. When a market gets bad news and finishes the day higher anyway, it usually means the bad news was already priced in. One day doesn't make a trend, but that's how bond markets tend to bottom: not on good news, but on bad news that stops working.
Gold and Emerging-Market Debt: Diversifiers Waiting on the Same Turn
Gold rose about 3.7% in the third quarter, bouncing off oversold levels, but gave back much of its gain by quarter-end. It's trading around $4,100 an ounce, still roughly 25% below its January peak near $5,600. The headwind is easy to name. Gold pays no interest, so when the Fed hikes, more than 80% of developed-market central banks hike with it, and the dollar hits new highs, the opportunity cost of holding it rises. Emerging-market bonds lost about 3.3% in the quarter in dollar terms, in line with U.S. bonds, as rising Treasury yields pulled down nearly all fixed income.
The point I made at mid-year still holds. Both are leveraged to the same reversal: real yields and the dollar coming down. That's the path we expect as core inflation cools and the Fed's work is done. Diversifiers don't earn their keep every quarter. They earn it over a full cycle — and they're most valuable when stocks and traditional bonds fall together, which we've seen more often since 2021.
The Midterms and Fourth-Quarter Seasonality
The midterm elections are November 3, and I'm already hearing the question: should I get out until it's over?
History says that's usually a costly instinct. Since 1945, the S&P 500 has averaged about a 4.2% gain in the fourth quarter, rising about 85% of the time. In midterm years, the fourth quarter has averaged closer to 6.4%, according to CFRA, as election uncertainty lifts. Bank of America notes the S&P 500 has been higher six and twelve months after every postwar midterm election.
Two cautions. First, averages aren't forecasts — there have been midterm fourth quarters with double-digit declines. Second, 2026 hasn't followed the usual midterm script. Normally the months before a midterm are weak and the rally comes after. This year stocks are already up double digits, so some of that relief may already be in the price.
My takeaway isn't "buy because of the calendar." It's that elections are a poor reason to change a long-term plan. Whichever party controls Congress in January, the things that drive a portfolio over the next decade — earnings, interest rates, and the price you paid — matter far more than who wins in November. Based on independent polling, the most likely outcome is divided government, with Democrats controlling the House and Republicans the Senate, a setup that has historically been constructive for markets. We'll cover the election in more depth in an upcoming episode.
What This Means for Your Portfolio
Our base case for the rest of the year: a slow-growing U.S. economy carried by AI investment, a labor market that's soft but not breaking, core inflation that cools more slowly than we'd like as oil leaks into services, and a Fed that may hike again but is close to done. The biggest wild card is oil, and that's a question about war, not economics.
Here's what that means heading into year-end:
1. Rebalance. Four stocks drove the market this quarter. If your technology weighting has crept up again, trim it back to target and add to what lagged — which right now means bonds and international.
2. Put idle cash to work in high-quality bonds. Ten-year Treasuries above 5% and municipal yields near 5% are the best starting point for income investors in about 25 years.
3. Harvest the losses bonds handed you. The third-quarter bond selloff likely left losses in taxable accounts. Selling and swapping into a similar — not identical — fund can capture a tax loss while keeping your exposure. Mind the wash-sale rule.
4. Do your year-end planning now, not December 28. Required minimum distributions, Roth conversions, and charitable gifts all need attention before year-end.
5. Don't trade the election. Your plan should already account for the possibility of a volatile November.
6. Get a second opinion. If 5% bond yields or $100 oil have you rethinking your plan, that's a great reason to talk.
That's how we practice stewardship at Capital Stewards — not by guessing the next headline, but by building portfolios intentionally, staying honest about what's working and what isn't, and keeping your long-term goals at the center.
Frequently Asked Questions
Is inflation coming back in 2026? Headline inflation rose to 3.7% in September on higher gasoline prices, and core CPI ticked up to 2.6%. We expect core inflation to resume cooling as used-car prices and rents soften, but more slowly than hoped — likely falling below 2.5% in the first half of 2027 rather than by year-end.
Why did the Federal Reserve raise rates in September 2026? The Fed raised rates a quarter point to 3.75%–4.00% on September 16, citing a resilient economy, elevated inflation, and a prolonged energy shock. Fed projections point to roughly one more increase at most, fewer than markets priced at the end of September.
Are bonds a good investment with the 10-year Treasury above 5%? We think high-quality bonds offer their most attractive starting yields in about 25 years. A 5.3% Treasury offers a real return of roughly 2.5% after inflation, and a 4.8% municipal bond is worth about 7.6% on a taxable-equivalent basis for investors in the 37% federal bracket.
Is the stock market in a bubble? By the numbers, no. S&P 500 earnings are growing faster than prices, and the forward price-to-earnings ratio has fallen from 22.2x in January to about 19.1x in October — near its 10-year average. The main risk is concentration in a handful of large technology stocks.
Why are diesel prices so high? The refining margin, not crude oil, drives most of the increase. Refined-fuel exports through the Strait of Hormuz are below a fifth of pre-war levels, and refinery outages elsewhere have tightened supply, pushing the diesel crack spread to a record of about $111 a barrel in September.
Should I sell stocks before the 2026 midterm elections? History suggests not. The S&P 500 has averaged a 6.4% gain in the fourth quarter of midterm years and has been higher 12 months after every postwar midterm. Elections are a poor reason to change a long-term plan.
Brian Seay, CFA, is the Founding Partner of Capital Stewards, a fee-only fiduciary registered investment adviser based in Huntsville, Alabama, serving entrepreneurs, engineers, defense contractors, and retirees across North Alabama, Georgia, and Tennessee. The CFA (Chartered Financial Analyst) designation is a globally recognized professional credential in investment analysis and portfolio management.
Have questions about how your portfolio is positioned for year-end? Schedule a conversation with Capital Stewards.